Columns
Cartoons
Podcasts
Tipsheet
Videos
MY ACCOUNT
Account Settings
Newsletter Subscriptions
Log Out
Subscribe
LOGIN
Login
MY ACCOUNT
Account Settings
Newsletter Subscriptions
Comment Settings
Log Out
LOGIN
Subscribe
Tipsheet
Columns
Cartoons
Podcasts
Videos
Contact Us
Terms & Conditions
Privacy Policy
California - Do Not Sell My Personal Information
California CCPA Notice
Senior Sounds Off After USC Cancels Its Main Graduation Ceremony
Leah Barkoukis
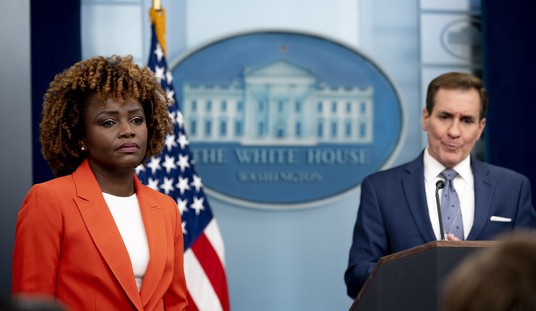
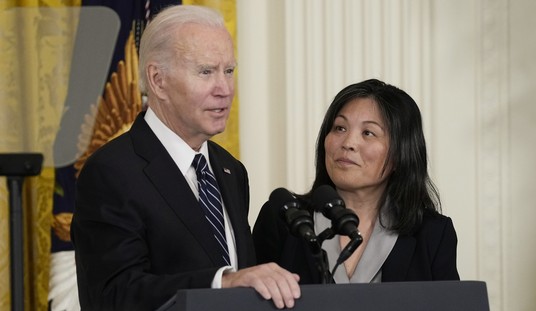
Top Biden Aides Didn't Have Anything Nice to Say About Karine Jean-Pierre: Report
Spencer Brown
'Lack of Clarity and Moral Leadership': NY Senate GOP Leader Calls Out Democratic Failings on Columbia U.
Rebecca Downs
Another State Will Not Comply With Biden's Rewrite of Title IX
Madeline Leesman
Liberals Freak Out As Another So-Called 'Don't Say Gay Bill' Pops Up
Madeline Leesman
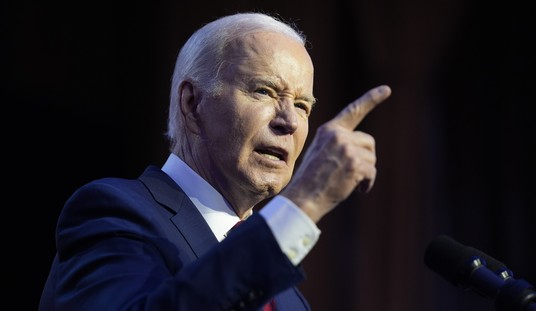
Biden Responds to Trump's Challenge to Debate Before November
Spencer Brown
California Mayor Attacked on Camera During Interview Promoting His City
Townhall Video
Advertisement
Columns
Are Buttigieg’s Latest Airline Rules Going to Get People Killed?
Katie Pavlich
These Ugly, Little Schmucks Need to Face Consequences
Kurt Schlichter
The Terrorists Are Running the Asylum
Spencer Brown
Iran's Nightmares
Victor Davis Hanson
Amanpour Repeats CNN's Gaza Lie
Brad Slager
Restore Order and Crush the Campus Jihadist Thugs
Josh Hammer
Leftist Reporters Pretend They're Not Partisan News Squashers
Tim Graham
The Problem Is Academia
Laura Hollis
Washington Should Clip Qatar’s Media Wing
Natalie Ecanow
The Most Disturbing Part of It
Erick Erickson
Inept Microsoft is Compromising National Security
Julio Rivera
All Columns
View Cartoon
Oh Look, Another Terrible Inflation Report
Spencer Brown
Here’s Why One University Postponed a Pro-Hamas Protest
Madeline Leesman
Stephen A. Smith Forced Into Apology Over Pro-Trump Comments
Townhall Video
Advertisement
Trending
1
Biden Responds to Trump's Challenge to Debate Before November
Spencer Brown
2
Top Biden Aides Didn't Have Anything Nice to Say About Karine Jean-Pierre: Report
Spencer Brown
3
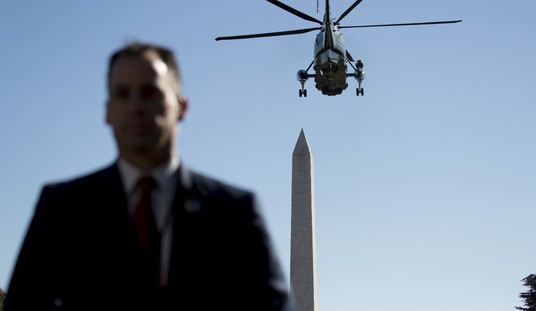
There's a Big Change in How Biden Now Walks to and From Marine One
Leah Barkoukis
4
Senior Sounds Off After USC Cancels Its Main Graduation Ceremony
Leah Barkoukis
5
California Mayor Attacked on Camera During Interview Promoting His City
Townhall Video
6
Iran's Nightmares
Victor Davis Hanson
7
Oh Look, Another Terrible Inflation Report
Spencer Brown
8
Are Buttigieg’s Latest Airline Rules Going to Get People Killed?
Katie Pavlich
9
These Ugly, Little Schmucks Need to Face Consequences
Kurt Schlichter
10
Trump Responds to Bill Barr's Endorsement in Typical Fashion
Leah Barkoukis
Advertisement
Members Only
Are Buttigieg’s Latest Airline Rules Going to Get People Killed?
Katie Pavlich
Another State Will Not Comply With Biden's Rewrite of Title IX
Madeline Leesman
These Ugly, Little Schmucks Need to Face Consequences
Kurt Schlichter
Polling on Support for Mass Deportations Has Some Surprising Findings. But Does It Matter?
Leah Barkoukis
Trump Has More Enthusiasm From Voters Than Biden Ever Will
Sarah Arnold
Amanpour Repeats CNN's Gaza Lie
Brad Slager
Advertisement
There's a Big Change in How Biden Now Walks to and From Marine One
Leah Barkoukis
Leader of Columbia's Pro-Hamas Encampment: Israel Supporters 'Don't Deserve to Live'
Guy Benson
The Gaza Genocide Narrative Suffers Another Major Deathblow
Matt Vespa
Trump Responds to Bill Barr's Endorsement in Typical Fashion
Leah Barkoukis
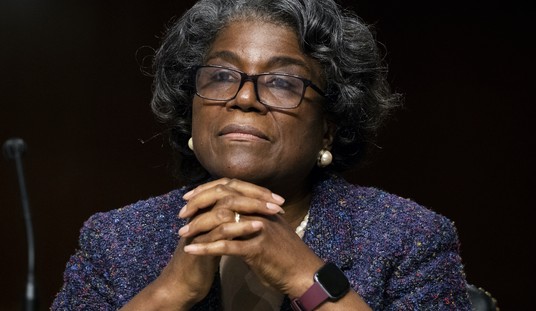
US Ambassador to the UN Calls Russia's Latest Veto 'Baffling'
Leah Barkoukis
Liberal Reporter Sees Some Serious Media Frustration on This Issue
Matt Vespa
Trending on Townhall Media
Biden Slips Up When Asked About Debating - His Handlers Are Going to Be Furious at What He Agreed To
Here’s Why Alvin Bragg's Case Against Donald Is Collapsing
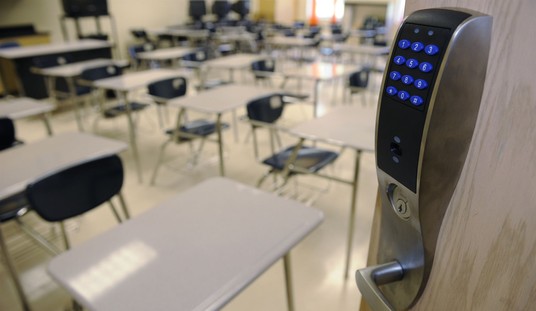
University of Florida ENDS Pro-Hamas Camps With a Few Very Simple Rules ... and Consequences
They Tried and Failed to Oust KJP
UK Gang Sentenced Over Massive Gun-Running Operation
There Was a Coup Attempt Against Karine Jean-Pierre, and the Details Are Something
If This Is True, Trump Will Win the Election Easily
About Those Alleged Posts of Snipers on the Campuses of Indiana and Ohio State Universities
Matt Vespa
Polling on Support for Mass Deportations Has Some Surprising Findings. But Does It Matter?
Leah Barkoukis
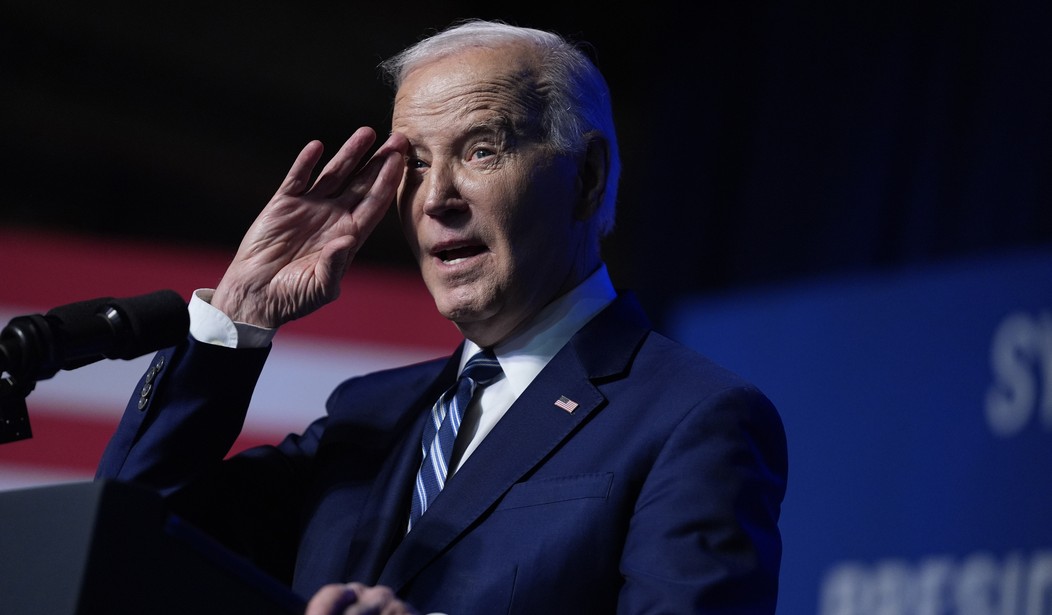
How Many More Times Will Joe Biden Mention This at the Podium This Year?
Matt Vespa
Thousand of Illegal Immigrants With Pounds of Fentanyl Apprehended by Border Patrol
Sarah Arnold
NYC Construction Workers: 'F*ck Joe Biden,' We Want Trump
Sarah Arnold
Advertisement
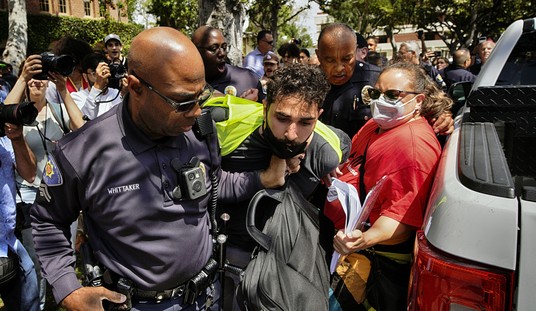
Pro-Hamas Students Set Up Another Camp... but This Jewish Student Isn't Cowering
Spencer Brown
Trump Speaks Out About 'Monumental' SCOTUS Immunity Arguments
Sarah Arnold
DHS Has a Warning for Foreign Students Participating in Anti-Israel Protests
Sarah Arnold
Biden's Latest Regulations Will Crash the Electric Grid
Katie Pavlich
USC Cancels Commencement Ceremony Amid Pro-Hamas Antics by Lunatic Students
Matt Vespa
Advertisement
Trump Has More Enthusiasm From Voters Than Biden Ever Will
Sarah Arnold
AOC Doubles Down on Support for Pro-Hamas Protests
Rebecca Downs
The Biden White House Is Still at Odds With The New York Times
Rebecca Downs
A Principal Was Removed, Faced Threats for Making Racist Comments. There's Just One, Major Problem.
Mia Cathell
Wow: Biden Just Endorsed a Disastrous, Unpopular Economic Policy That Will Inflict Even More Harm
Guy Benson
Advertisement
Is It Wrong to Deny Someone a Job Because They Have Demonic Face and Neck Tattoos?
Townhall Video
Newsom Unveils Bill in Response to Arizona's Impending Pro-Life Law
Madeline Leesman
NYPD Patrol Chief Shuts AOC Down After She Posts Defense of Pro-Hamas Agitators at Columbia
Katie Pavlich
NY Times Journalist Tries Defending Pro-Hamas Students. It Doesn't End Well for Her.
Townhall Video
Iran-Backed Terrorists Resume Attacks on U.S. Service Members in the Middle East
Spencer Brown
Advertisement
Another Poll on Battleground States Is Here to Toss Cold Water on Biden's Supposed Gains
Rebecca Downs
White House Attempt to Cover for Biden's Latest Gaffe Might Be Its Most Brazen Yet
Spencer Brown
US, 17 Other Nations Issue Joint Statement Calling on Hamas to Release Hostages
Leah Barkoukis
Stocks Tank After Disastrous First Quarter GDP Report
Spencer Brown
Could Texas Ban ‘Gender Nonconforming’ Teachers From Schools?
Madeline Leesman
Advertisement
Should Republicans Be Concerned About the Pennsylvania Primary Results?
Guy Benson
Terrorists Launch Attacks on Americans Building Biden’s Gaza Pier
Katie Pavlich
Florida Has Carried Out an Impressive Evacuation Operation in Haiti
Leah Barkoukis
Mike Davis' Internet Accountability Project Calls on Senate Republicans to Break Up Big Tech
Rebecca Downs
Police at UT Austin Had the Perfect Response to a Pro-Hamas Activist Flipping Them Off
Matt Vespa
Advertisement
The Pro-Hamas Activist Who Accosted Alec Baldwin Went Totally Insane During Piers Morgan Interview
Matt Vespa
Biden Administration's New Overtime Rule Blasted as an 'Attack on Small Businesses'
Leah Barkoukis
Secret Service Agent Assigned to Kamala Harris Suffers What Looks Like a Mental Breakdown
Matt Vespa