Columns
Cartoons
Podcasts
Tipsheet
Videos
MY ACCOUNT
Account Settings
Newsletter Subscriptions
Log Out
Subscribe
LOGIN
Login
MY ACCOUNT
Account Settings
Newsletter Subscriptions
Comment Settings
Log Out
LOGIN
Subscribe
Tipsheet
Columns
Cartoons
Podcasts
Videos
Contact Us
Terms & Conditions
Privacy Policy
California - Do Not Sell My Personal Information
California CCPA Notice
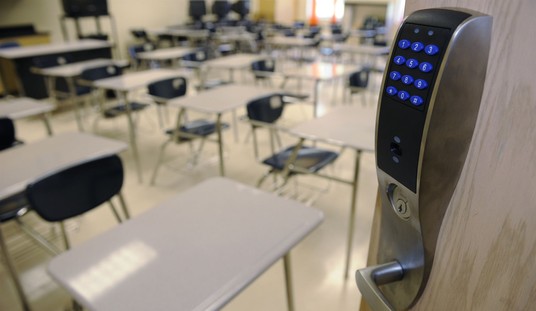
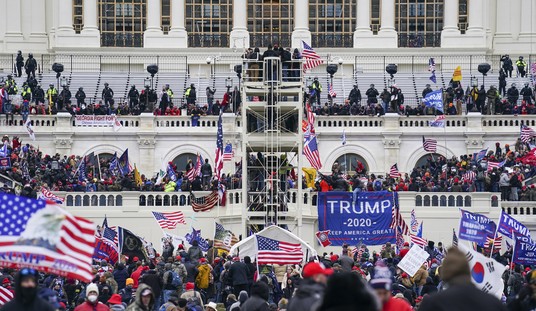
About Those Alleged Posts of Snipers on the Campuses of Indiana and Ohio State Universities
Matt Vespa
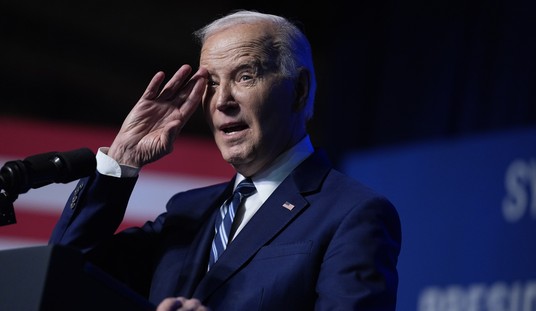
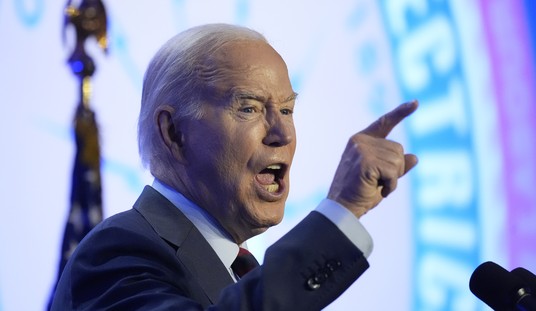
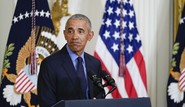
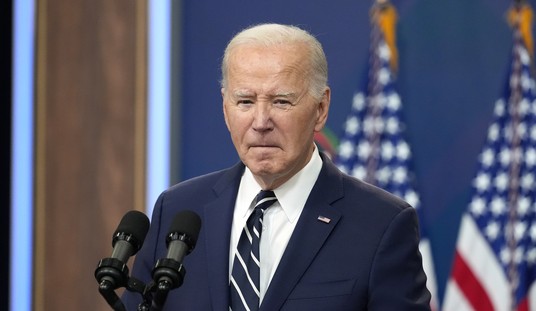
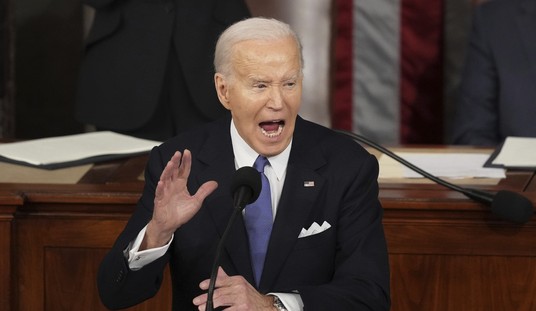
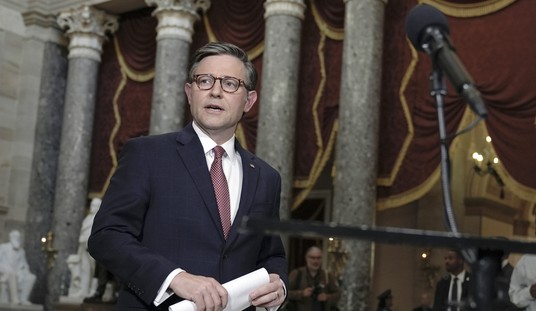
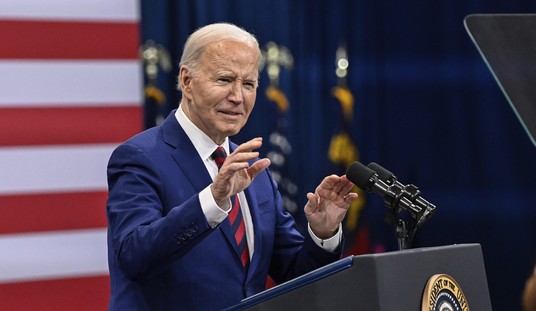
How Many More Times Will Joe Biden Mention This at the Podium This Year?
Matt Vespa
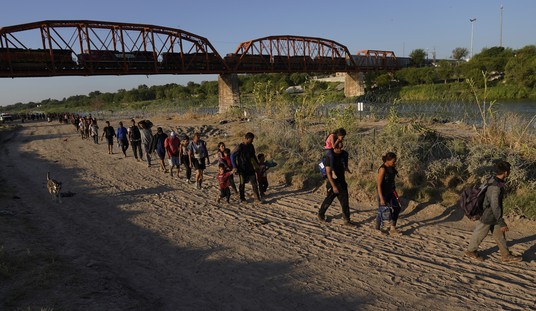
Thousand of Illegal Immigrants With Pounds of Fentanyl Apprehended by Border Patrol
Sarah Arnold
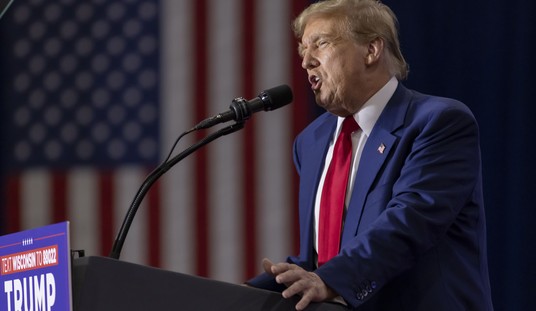
NYC Construction Workers: 'F*ck Joe Biden,' We Want Trump
Sarah Arnold
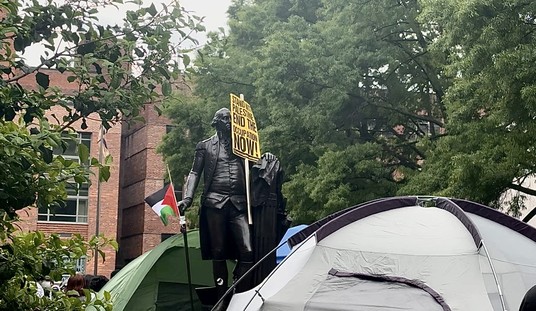
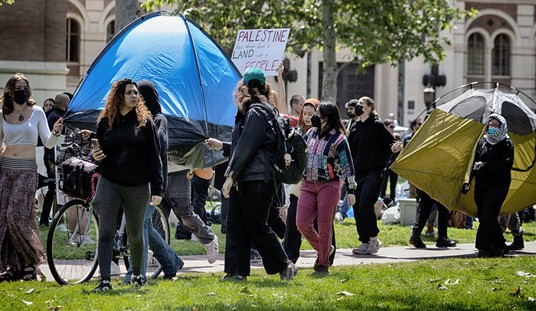
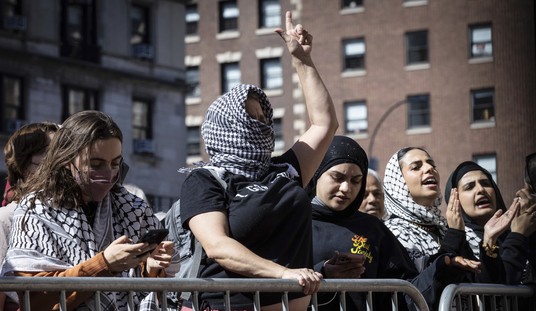
Pro-Hamas Students Set Up Another Camp... but This Jewish Student Isn't Cowering
Spencer Brown
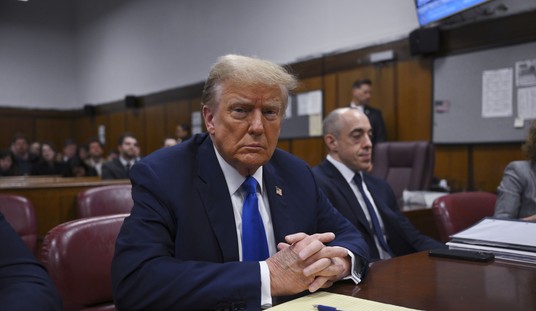
Trump Speaks Out About 'Monumental' SCOTUS Immunity Arguments
Sarah Arnold
DHS Has a Warning for Foreign Students Participating in Anti-Israel Protests
Sarah Arnold
Advertisement
Columns
Iran's Nightmares
Victor Davis Hanson
Amanpour Repeats CNN's Gaza Lie
Brad Slager
Restore Order and Crush the Campus Jihadist Thugs
Josh Hammer
Leftist Reporters Pretend They're Not Partisan News Squashers
Tim Graham
The Problem Is Academia
Laura Hollis
Washington Should Clip Qatar’s Media Wing
Natalie Ecanow
The Most Disturbing Part of It
Erick Erickson
Inept Microsoft is Compromising National Security
Julio Rivera
Leftist Activists Said 'Believe All Women' Didn’t Apply to Me
Paula Scanlan
Biden Fails Moral Leadership Test in Handling Anti-Semitic Campus Protests
Jenny Beth Martin
Sanctuary Cities Defund the Police to Pay for Illegal Immigration
William Davis
All Columns
View Cartoon
Biden's Latest Regulations Will Crash the Electric Grid
Katie Pavlich
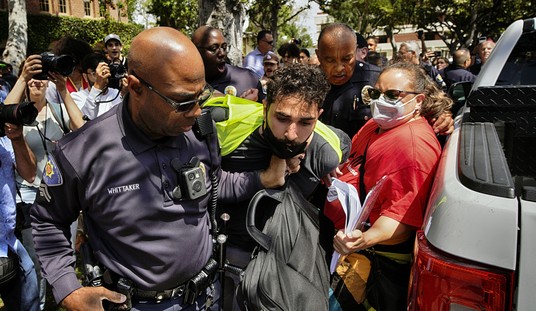
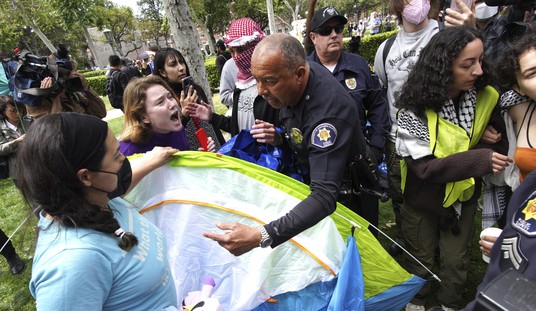
USC Cancels Commencement Ceremony Amid Pro-Hamas Antics by Lunatic Students
Matt Vespa
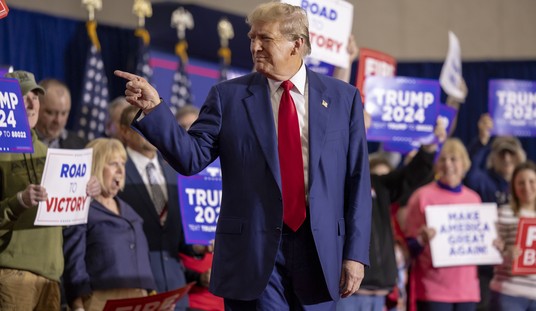
Trump Has More Enthusiasm From Voters Than Biden Ever Will
Sarah Arnold
Advertisement
Trending
1
Iran's Nightmares
Victor Davis Hanson
2
About Those Alleged Posts of Snipers on the Campuses of Indiana and Ohio State Universities
Matt Vespa
3
How Many More Times Will Joe Biden Mention This at the Podium This Year?
Matt Vespa
4
A Principal Was Removed, Faced Threats for Making Racist Comments. There's Just One, Major Problem.
Mia Cathell
5
Pro-Hamas Students Set Up Another Camp... but This Jewish Student Isn't Cowering
Spencer Brown
6
The Problem Is Academia
Laura Hollis
7
Restore Order and Crush the Campus Jihadist Thugs
Josh Hammer
8
Will Jewish Voters Stop Voting for the Democrats Who Want to Kill Them?
Kurt Schlichter
9
NYC Construction Workers: 'F*ck Joe Biden,' We Want Trump
Sarah Arnold
10
Trump Speaks Out About 'Monumental' SCOTUS Immunity Arguments
Sarah Arnold
Advertisement
Members Only
Trump Has More Enthusiasm From Voters Than Biden Ever Will
Sarah Arnold
Amanpour Repeats CNN's Gaza Lie
Brad Slager
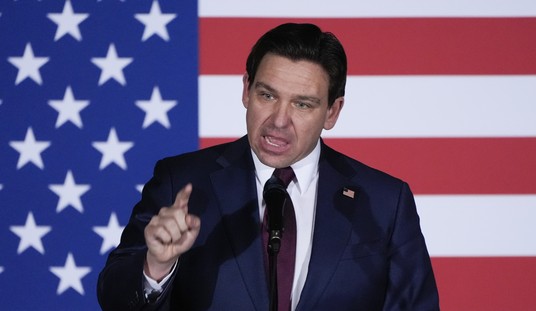
DeSantis Reveals How Florida Colleges Will Respond to Pro-Hamas Students
Madeline Leesman
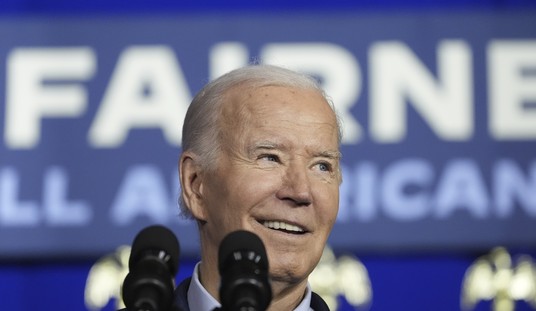
Wow: Biden Just Endorsed a Disastrous, Unpopular Economic Policy That Will Inflict Even More Harm
Guy Benson
Another Poll on Battleground States Is Here to Toss Cold Water on Biden's Supposed Gains
Rebecca Downs
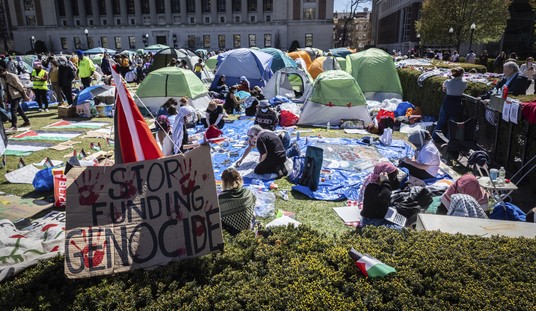
Students at Another Ivy League University Get Ready to Set Up Encampment
Leah Barkoukis
Advertisement
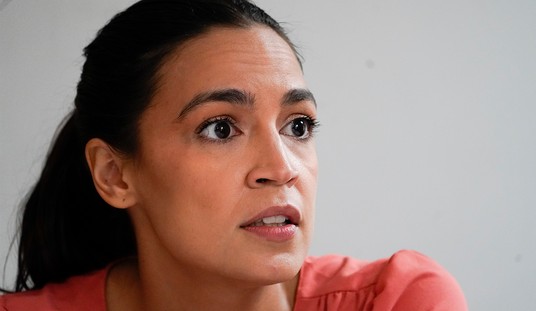
AOC Doubles Down on Support for Pro-Hamas Protests
Rebecca Downs
The Biden White House Is Still at Odds With The New York Times
Rebecca Downs
A Principal Was Removed, Faced Threats for Making Racist Comments. There's Just One, Major Problem.
Mia Cathell
Wow: Biden Just Endorsed a Disastrous, Unpopular Economic Policy That Will Inflict Even More Harm
Guy Benson
Is It Wrong to Deny Someone a Job Because They Have Demonic Face and Neck Tattoos?
Townhall Video
Newsom Unveils Bill in Response to Arizona's Impending Pro-Life Law
Madeline Leesman
Trending on Townhall Media
Maybe the Supreme Court Should ‘Take a Walk:’ A Deep Dive Into Thursday’s Oral Arguments
Shocker: NY Times Absolutely Shreds Joe Biden for Hiding From the Media
Democrats May Regret Trying Trump in N.Y. Court After His Latest Announcement
Highland Fling: Scotland's Execrable First Racist Tosses Green Party From Power Deal in Last-Ditch Switch
NY Judge: The Second Amendment Doesn't Exist Here
Justice Brett Kavanaugh Asks Why Barack Obama Was Never Prosecuted
SHOCKING: Pro-Hamas Protest Leader Suggests Murdering Jews While Negotiating With Columbia Officials
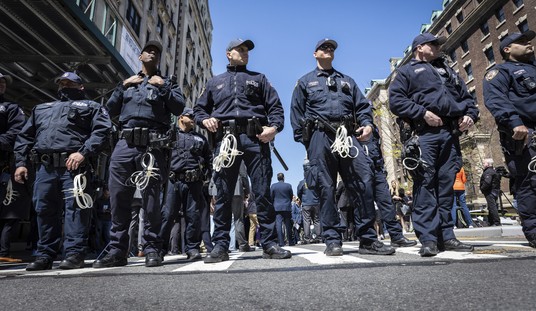
NYPD Patrol Chief Shuts AOC Down After She Posts Defense of Pro-Hamas Agitators at Columbia
Katie Pavlich
NY Times Journalist Tries Defending Pro-Hamas Students. It Doesn't End Well for Her.
Townhall Video
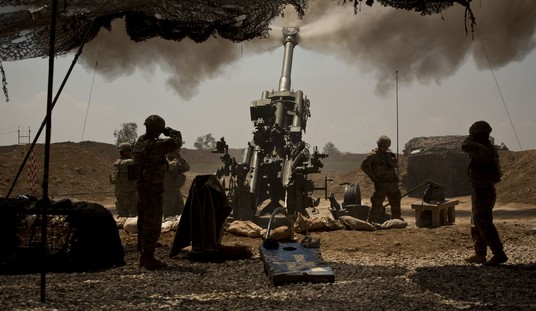
Iran-Backed Terrorists Resume Attacks on U.S. Service Members in the Middle East
Spencer Brown
Another Poll on Battleground States Is Here to Toss Cold Water on Biden's Supposed Gains
Rebecca Downs
White House Attempt to Cover for Biden's Latest Gaffe Might Be Its Most Brazen Yet
Spencer Brown
Advertisement
US, 17 Other Nations Issue Joint Statement Calling on Hamas to Release Hostages
Leah Barkoukis
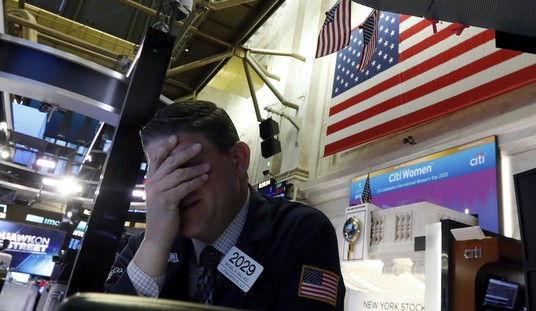
Stocks Tank After Disastrous First Quarter GDP Report
Spencer Brown
Could Texas Ban ‘Gender Nonconforming’ Teachers From Schools?
Madeline Leesman
Should Republicans Be Concerned About the Pennsylvania Primary Results?
Guy Benson
Terrorists Launch Attacks on Americans Building Biden’s Gaza Pier
Katie Pavlich
Advertisement
Florida Has Carried Out an Impressive Evacuation Operation in Haiti
Leah Barkoukis
Mike Davis' Internet Accountability Project Calls on Senate Republicans to Break Up Big Tech
Rebecca Downs
Police at UT Austin Had the Perfect Response to a Pro-Hamas Activist Flipping Them Off
Matt Vespa
The Pro-Hamas Activist Who Accosted Alec Baldwin Went Totally Insane During Piers Morgan Interview
Matt Vespa
Biden Administration's New Overtime Rule Blasted as an 'Attack on Small Businesses'
Leah Barkoukis
Advertisement
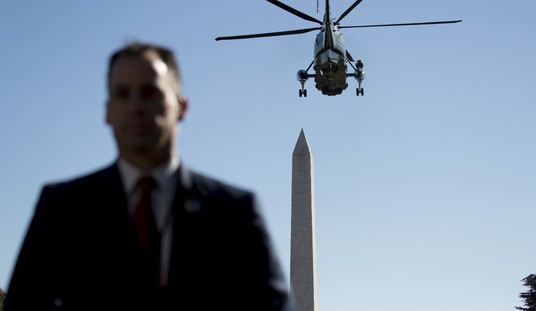
Secret Service Agent Assigned to Kamala Harris Suffers What Looks Like a Mental Breakdown
Matt Vespa
Students at Another Ivy League University Get Ready to Set Up Encampment
Leah Barkoukis
Here's the Video Exposing What NYU's Pro-Hamas Students Really Think
Matt Vespa
NYT Claims Trump Is Getting 'Favorable Treatment' from the NYPD
Sarah Arnold
NYPD Arrests Dozens Who Besieged Area Near Chuck Schumer's Home
Matt Vespa
Advertisement
Texas Doesn't Take Passive Approach to Anti-Israel Mobs
Sarah Arnold
Columbia Prof Who Called to Defund the Police, Now Wants Police to Protect Him from Anti-Israel Protests
Sarah Arnold
Mike Johnson Addresses Anti-Israel Hate As Hundreds Harass the School’s Jewish Community
Sarah Arnold
White House Insists Biden Has Been 'Very Clear' About His Position on Pro-Hamas Campus Chaos
Spencer Brown
DeSantis Offers Perfect Response to Biden's Abortion Message
Rebecca Downs
Advertisement
Former Democratic Rep. Who Lost to John Fetterman Sure Doesn't Like the Senator He Turned Out to Be
Rebecca Downs
New Biden Emails Reveal Details About the Ukraine Whistleblower Who Got Trump Impeached
Matt Vespa
Biden Can't Capitalize on His Supposed 'Superpower' for 2024
Matt Vespa
Pelosi's Daughter Criticizes J6 Judges Who are 'Out for Blood' After Handing Down Harsh Sentences
Sarah Arnold
Lawmakers in One State Pass Legislation to Allow Teachers to Carry Guns in Schools
Madeline Leesman
Advertisement
Yale Student Stabbed at Pro-Hamas Demonstration Describes How the Campus Is a Terror Snake Pit
Matt Vespa
Watch Biden Lose the Battle With His Teleprompter Again
Spencer Brown
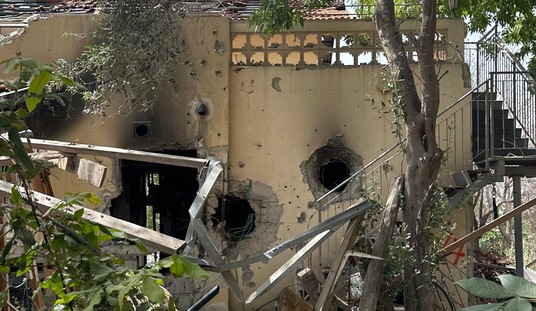
'This Is Where the Systematic Killing Took Place': 200 Days of War From Israeli's South
Katie Pavlich