Columns
Cartoons
Podcasts
Tipsheet
Videos
MY ACCOUNT
Account Settings
Newsletter Subscriptions
Log Out
Subscribe
LOGIN
Login
MY ACCOUNT
Account Settings
Newsletter Subscriptions
Comment Settings
Log Out
LOGIN
Subscribe
Tipsheet
Columns
Cartoons
Podcasts
Videos
Contact Us
Terms & Conditions
Privacy Policy
California - Do Not Sell My Personal Information
California CCPA Notice
Here's Who Trump Is Blaming for the Pro-Hamas Student Protests
Leah Barkoukis
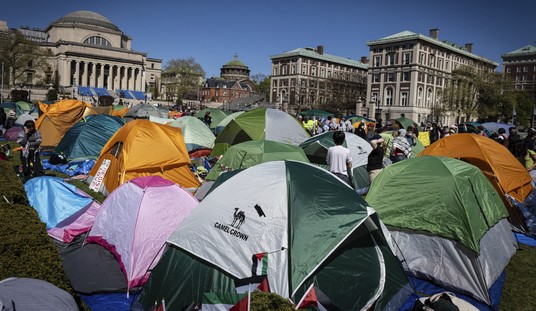
Following Anti-Israel Protests, Columbia Switches to Hybrid Classes for the Rest of the Semester
Madeline Leesman
Senators Deliver Message to Biden on Schools Allowing 'Pro-Terrorist Mobs'
Spencer Brown
Here's How Sarah Huckabee Sanders Is Welcoming Education Secretary Miguel Cardona to Arkansas
Spencer Brown
Has Bill Maher Finally Seen the Light?
Townhall Video
Some of the Illegal Aliens DeSantis Sent to Martha’s Vineyard Will Be Permitted to Stay in the U.S.
Madeline Leesman
Judge Clashes With Trump Attorney at Gag Order Hearing
Spencer Brown
Advertisement
Columns
The Left Gets Its Own Charlottesville
Matt Vespa
Democrats Are Going to Get Someone Killed and They’re Perfectly Fine With It
Derek Hunter
Postcards From the Edge of Cannibalism
Salena Zito
Why Small Businesses Hate Bidenomics
Stephen Moore
The Empire Begins to Strike Back
Cal Thomas
The Empires Begin to Strike Back
Cal Thomas
Congress Should Not Pass DJI Drone Ban Legislation
Steve Sherman
To Defend Free Speech, the Senate Should Reject the TikTok Ban
Pratik Chougule
With Cigarette Sales Declining, More Evidence Supports the Role of Flavored Vapes in Helping Adults Quit
Lindsey Stroud
Psst…I Think the President Is Totally Senile
Kurt Schlichter
Maybe Try Not Sucking
Derek Hunter
All Columns
View Cartoon
Media Stunned by Trump's Soaring Poll Numbers
Townhall Video
Biden’s ‘Ghost Gun’ Crackdowns Head to the Supreme Court
Madeline Leesman
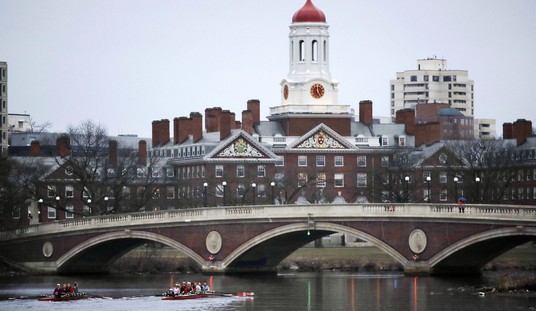
Harvard Takes Action Against Pro-Hamas Student Group
Leah Barkoukis
Advertisement
Trending
1
Here's How Sarah Huckabee Sanders Is Welcoming Education Secretary Miguel Cardona to Arkansas
Spencer Brown
2
Here's Who Trump Is Blaming for the Pro-Hamas Student Protests
Leah Barkoukis
3
Democrats Are Going to Get Someone Killed and They’re Perfectly Fine With It
Derek Hunter
4
Judge Clashes With Trump Attorney at Gag Order Hearing
Spencer Brown
5
Senators Deliver Message to Biden on Schools Allowing 'Pro-Terrorist Mobs'
Spencer Brown
6
Psst…I Think the President Is Totally Senile
Kurt Schlichter
7
The Empire Begins to Strike Back
Cal Thomas
8
Has Bill Maher Finally Seen the Light?
Townhall Video
9
Postcards From the Edge of Cannibalism
Salena Zito
10
Google Doesn’t Want You to Read This
Spencer Brown
Advertisement
Members Only
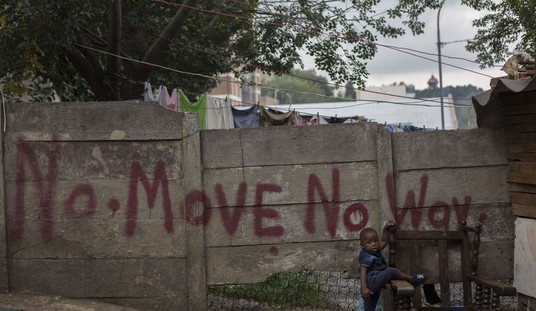
Here's What Happened When a New York Homeowner Found Squatters on Her Property
Madeline Leesman
NBC's New 2024 Poll Is Mostly Good News for Trump, But...
Guy Benson
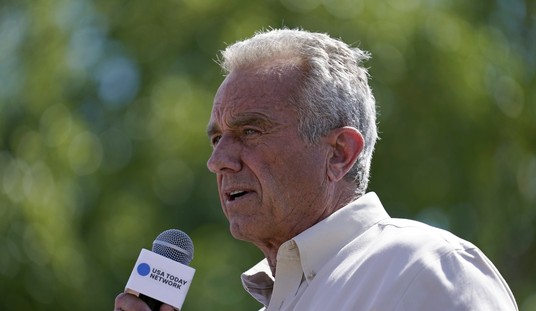
RFK Jr. Just Got on the Ballot in a Key Swing State...and Dems Are Getting Worried
Leah Barkoukis
The Left Gets Its Own Charlottesville
Matt Vespa
JB Pritzker's Sunday Show Appearance Was Such a Mess, Of Course He's a Biden Campaign Co-Chair
Rebecca Downs
Trump Killed Humor in DC
Brad Slager
Advertisement
NBC's New 2024 Poll Is Mostly Good News for Trump, But...
Guy Benson
Pro-Hamas Students at CA State Polytechnic University Went January 6 With Police
Matt Vespa
Former Rolling Stone Editor's Biting Attack on the NYT's 'Adults' Piece About Speaker Johnson
Matt Vespa
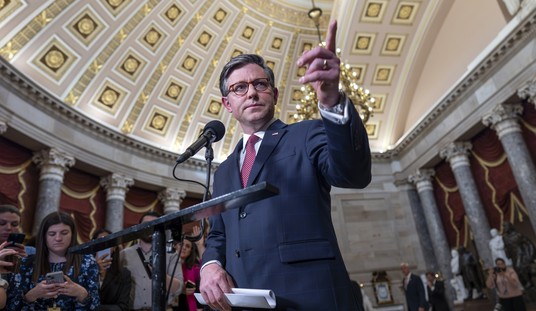
Trump Comes to Johnson's Defense
Leah Barkoukis
Head of Israel's Military Intelligence Resigns Over 10/7
Leah Barkoukis
Ted Cruz Insists University Professors Turning 'Blind Eye' to Antisemitism 'Should Resign in Disgrace'
Rebecca Downs
Trending on Townhall Media
NYC Man Convicted Over Gunsmithing Hobby After Judge Says 2nd Amendment 'Doesn't Exist in This Courtroom'
Democrats Are Riding the Tiger Right Into a Spicy Summer
Biden Tries to Dunk on Trump and Infrastructure, Gets SCHOOLED on His Record Instead
Seattle Hospital Flees Texas Over Trans Treatments
NY Judge: The Second Amendment Doesn't Exist Here
CNN Commits More Media Malpractice in Gaza, Runs PR for Hamas Regarding Bodies 'Found' at Hospital
Michelle Obama's Big Day Out
RFK Jr. Just Got on the Ballot in a Key Swing State...and Dems Are Getting Worried
Leah Barkoukis
If Columbia University's President Considers This a Form of Protesting, The Terror Camp Isn't Coming Down
Matt Vespa
Pro-Hamas Activists March on NYPD HQ After Police Dismantled NYU's Pro-Hamas Camp
Matt Vespa
Here's What Kathy Hochul, Chuck Schumer Are Saying About Columbia University's Pro-Hamas Protests
Rebecca Downs
Patriots Owner to Columbia University: Say Goodbye to My Money
Matt Vespa
Advertisement
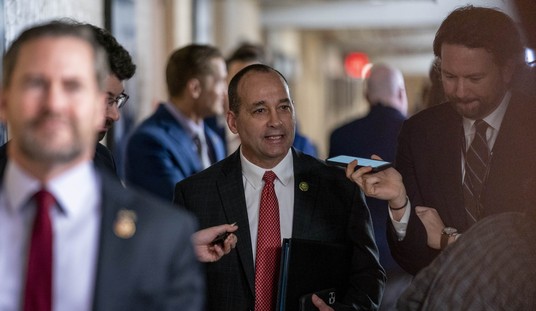
Republican Jewish Coalition Endorses Bob Good's Primary Opponent Due to Vote Against Aid for Israel
Rebecca Downs
Minnesota State Sen. Arrested for Burglary, Raising 'Big Implications' Over Razor-Thin Majority
Rebecca Downs
A Girl Went to Wendy's and Ended Up With Permanent Brain Damage
Matt Vespa
Carpetbagger Eugene Vindman's Campaign Is a Mess
Rebecca Downs
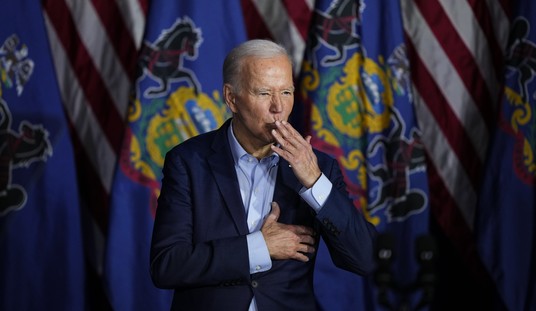
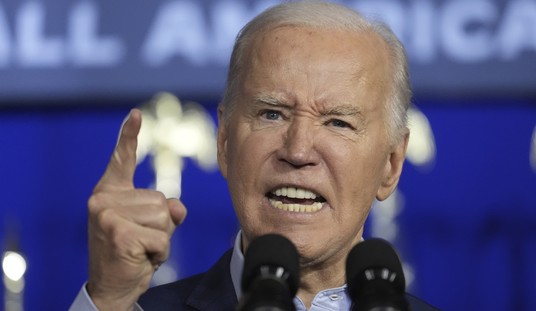
President Biden Has His 'Very Fine People on Both Sides' Moment
Spencer Brown
Advertisement
The New York Times' Coverage of Columbia's Hamas Student Uprising Is Something Else
Spencer Brown
WHOOPS: Jayapal Says the Quiet Part Out Loud About the Trump Trial
Townhall Video
JB Pritzker's Sunday Show Appearance Was Such a Mess, Of Course He's a Biden Campaign Co-Chair
Rebecca Downs
Middle School Girls Were Forced to Compete Against a 'Trans' Athlete. Here's What Happened Next.
Madeline Leesman
Ilhan Omar's Daughter: How Dare You Make Me Face the Consequences of My Own Actions!
Guy Benson
Advertisement
Planned Parenthood Refuses to Hand Over Documents on Transgender Care for Kids
Madeline Leesman
GOP Reps From New York Have a Message for Columbia University's President
Spencer Brown
Here's What Happened When a Jewish Professor Tried Entering Columbia's Campus
Matt Vespa
Arizona’s Supreme Court Upheld Legislation to Protect Unborn Life. Here’s How Gavin Newsom Responded.
Madeline Leesman
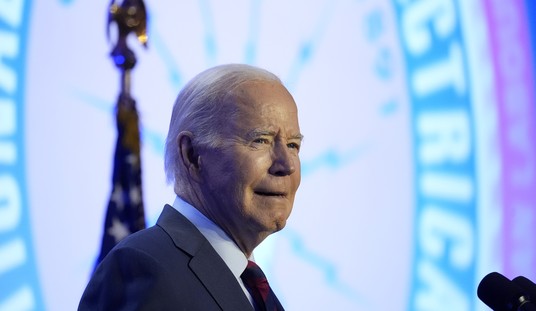
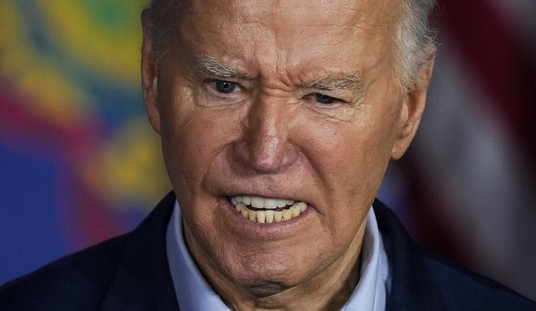
Joe Biden's Ham-Fisted Statement on Pro-Hamas Campus Chaos Is Baseless Bluster
Spencer Brown
Advertisement
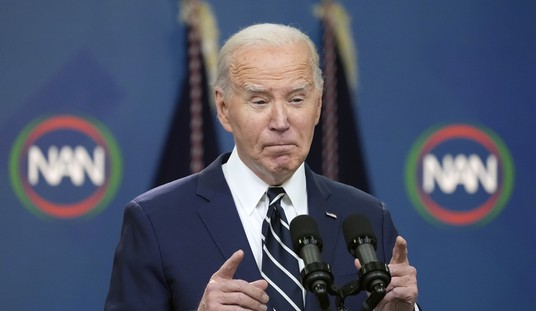
Biden Is Always Wrong
Kurt Schlichter
Illegal Aliens Are Harassing Home Depot Customers, So the Store Is Taking Action
Madeline Leesman
Republican Congresswoman Has a Warning for Columbia University
Spencer Brown
Papua New Guinea PM Hits Back After Biden's Cannibal Story
Leah Barkoukis
Surprise: Famous Hamas Sympathizer Caught in Racist, Homophobic Rant
Guy Benson
Advertisement
ESPN Host Had an Interesting Take on the 'Jail Trump Now' Crowd
Matt Vespa
Does the New NPR CEO Have a Burner Account?
Matt Vespa
LA Mayor's Home Was Broken Into...Again
Leah Barkoukis
HRC Made Some Rather Unhinged Claims About What Trump Wants to Do to His Political Opponents
Leah Barkoukis
Why Jewish Students at Columbia Were Just Urged to Go Home
Leah Barkoukis
Advertisement
Bill Barr's 2024 Decision Might Irritate Some, But It Shows He Knows Who the Real Enemy Is
Matt Vespa
Schumer Getting Rid of Mayorkas Impeachment Could Affect Democrats in November and Beyond
Rebecca Downs
Democrats Promise to Keep Mike Johnson’s Job Alive After Ukraine Aid Package Passed
Sarah Arnold